General

The 28/36 Rule Explained
General

The 28/36 Rule Explained | A Smart Guide for Home Buyers

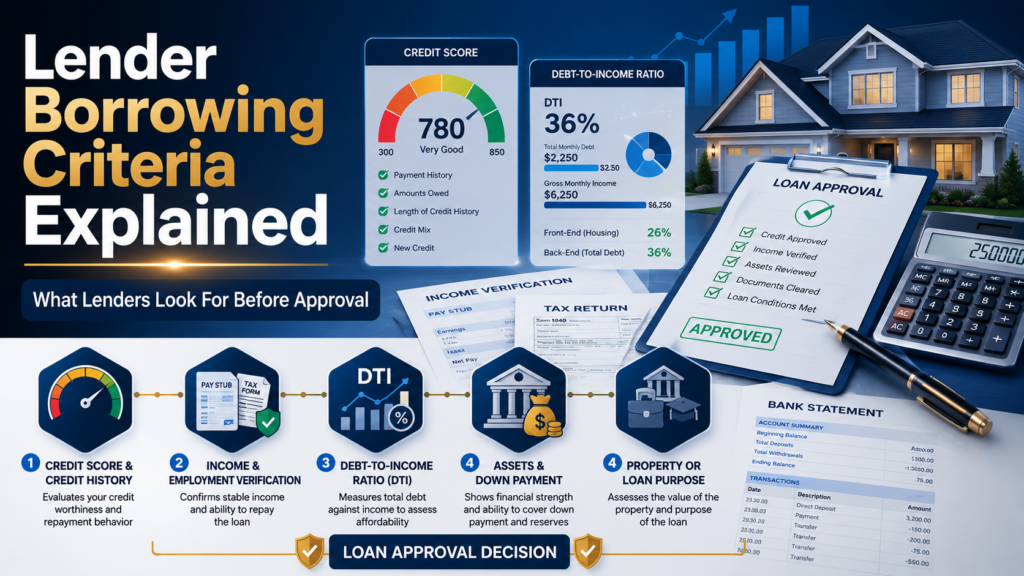
If you’re shopping for your first home or trying to understand how much house you can afford, The 28/36 Rule Explained is one of the most important concepts you’ll encounter. This mortgage affordability guideline gives home buyers a clear, practical framework for evaluating how much they can borrow without overextending their finances. The rule works like this: no more than 28% of your gross monthly income should go toward housing costs, and no more than 36% should go toward all debt combined. These two thresholds β€” called the front-end ratio and back-end ratio β€” are the backbone of mortgage underwriting guidelines used by lenders across the United States. Understanding the 28/36 rule explained for home buyers helps you set realistic expectations before you apply, avoid financial stress after you buy, and negotiate your loan from a position of knowledge. This guide covers exactly what the rule means, how to calculate both ratios, where exceptions exist, and how to apply it to your own financial situation. What Is the 28/36 Rule?Β  The rule has two distinct components: The 28% front-end limit (also called the housing expense ratio or household expense ratio) covers principal, interest, property taxes, and homeowner’s insurance β€” sometimes abbreviated as PITI. The 36% back-end limit (also called the total debt ratio) covers PITI plus all other recurring monthly debt payments, including car loans, student loans, credit cards, and personal loans. These percentages are not laws they are affordability benchmarks grounded in decades of mortgage underwriting guidelines and risk mitigation research. Lenders including Rocket Mortgage, Chase Bank, and U.S. Bank use variations of these thresholds in their qualification processes, though actual limits vary by loan type and lender. How the 28/36 Rule Works in Practice The 28% Front-End Ratio: Housing Expense Threshold The front-end ratio measures only your housing costs against your income. It answers the question: what percentage of your gross monthly income would go toward your monthly mortgage payment? Housing costs counted in this ratio typically include: Β Mortgage principal and interest (P&I) Β Property taxes (monthly escrow portion) Β Homeowner’s insurance (monthly escrow portion) Β HOA fees (if applicable) Β Private mortgage insurance or PMI (if applicable) Formula: Front-End Ratio = Monthly Housing Costs / Gross Monthly Income x 100 Example: If your gross monthly income is $5,500 and your estimated PITI is $1,400, your front-end ratio is 1,400 / 5,500 x 100 = 25.5%. This falls comfortably within the 28% threshold. The 36% Back-End Ratio: Total Debt Load Management The back-end ratio takes a wider view. It includes your housing payment plus every other recurring monthly debt obligation. This is the number lenders scrutinize most closely because it reflects your true debt load management burden. Debts included in the back-end ratio: Β All housing costs (same as front-end) Β Auto loan payments Β Student loan payments (minimum or calculated payment) Β Credit card minimum payments Β Personal loan installments Β Any other installment or revolving debt with a monthly obligation Formula: Back-End Ratio = (Monthly Housing Costs + All Monthly Debts) / Gross Monthly Income x 100 Example: Using the same $5,500 income, if you have $400 in car payments, $200 in student loans, and $100 in credit card minimums β€” your existing debt is $700/month. Adding the $1,400 PITI: $2,100 / $5,500 x 100 = 38.2%. This exceeds the 36% guideline, signaling that debt reduction before applying may be beneficial. Why Lenders Use the 28/36 Rule Lenders use this rule as part of their underwriting process to assess repayment ability and creditworthiness. Research from institutions including the Federal Reserve and academic studies cited by the Consumer Financial Protection Bureau (CFPB) supports the idea that borrowers with housing ratios above 28-30% face higher rates of mortgage delinquency. The rule also aligns with Qualified Mortgage (QM) standards established by the CFPB under the Ability-to-Repay framework, which requires lenders to verify that borrowers can reasonably afford the loans they originate. How to Apply the 28/36 Rule: Step by Step Follow these steps to calculate your own front-end and back-end ratios and determine where you stand relative to the 28/36 guideline. Calculate Your Gross Monthly Income β€” Use your pre-tax monthly income. If salaried, divide your annual salary by 12. If self-employed, average your last two years of net profit. Include only stable, verifiable income sources. Estimate Your Monthly Housing Costs (PITI) Get a mortgage payment estimate based on the loan amount, interest rate, and term you are considering. Add estimated monthly property taxes and homeowner’s insurance. Include PMI if your down payment is less than 20%. Calculate Your Front-End Ratio β€” Divide your estimated monthly PITI by your gross monthly income and multiply by 100. If the result is 28% or below, you meet the front-end guideline. List All Existing Monthly Debt Payments β€” Write down every recurring monthly debt obligation: car loans, student loans, minimum credit card payments, personal loans, and any other installment obligations. Β Add Housing and Debt Payments Together β€” Sum your estimated PITI and all existing monthly debts to get your total monthly obligations. Β Calculate Your Back-End Ratio β€” Divide total monthly obligations by your gross monthly income and multiply by 100. If the result is 36% or below, you meet the back-end guideline. Evaluate Your Results β€” If both ratios are within guidelines, you are in a strong position to apply. If either exceeds the threshold, identify whether paying down debt or increasing income would bring you into range. Factor in Compensating Factors β€” If your ratios exceed the guidelines, consider whether you have strong compensating factors: high credit score (FICO 740+), significant cash reserves, large down payment, or stable long-term employment. These may allow lenders to approve ratios above the standard limits. Compare Loan Programs β€” Different loan types have different official DTI limits. Compare conventional, FHA, VA, and USDA programs to find which fits your ratios best before applying. How Lenders Apply the 28/36 Rule: Variations by Loan Type The 28/36 rule is a general guideline, not a universal hard requirement. Different loan programs apply different debt-to-income ratio limits, and

Lender Borrowing Criteria
General

Lender Borrowing Criteria Explained | What Every Borrower Must Know

Whether you’re applying for a mortgage, personal loan, student loan, or small business loan, lender borrowing criteria are the gatekeepers standing between you and your financing. These are the specific financial standards that banks, credit unions, mortgage companies, and government-backed lenders use to decide if you’re a trustworthy borrower. Understanding lender borrowing criteria before you apply can make the difference between approval and rejection β€” or between a competitive interest rate and a costly one. This guide breaks down exactly what lenders look for, how each factor is evaluated, and what you can do to strengthen your application. We cover the full underwriting process from credit scores and income verification to debt-to-income ratios and asset liquidity. Whether you’re a first-time homebuyer, a student exploring loan options, or a business owner applying for an SBA loan, this article gives you the practical knowledge to move forward with confidence. What Is Lender Borrowing Criteria?Β  Lender borrowing criteria vary depending on the type of loan, the lender, and whether the loan is conventional, government-backed, or commercial. However, most lenders evaluate borrowers across five core areas: credit history, income and employment, debt-to-income ratio, assets, and the property or purpose of the loan The 5 Core Lender Borrowing Criteria Lenders use a structured underwriting process to evaluate risk. While specific thresholds vary by lender and loan type, five criteria form the foundation of nearly every loan decision in the United States. 1. Credit Score and Credit History Your credit score β€” most commonly a FICO score is one of the most influential factors in any lending decision. FICO scores range from 300 to 850. Most conventional mortgage lenders require a minimum FICO score of 620, while FHA loans may allow scores as low as 500 with a larger down payment. The three major credit bureaus β€” Equifax, TransUnion, and Experian β€” each generate credit reports. Mortgage lenders typically pull all three and use the middle score. Lenders review not just your score but the underlying history: payment record, length of credit history, credit mix, new inquiries, and amounts owed. According to FICO, payment history accounts for 35% of your score, making on-time payments the single most important factor. Amounts owed (credit utilization) makes up 30%. 2. Income and Employment Verification Lenders need to confirm that you earn enough money, and that your income is stable and likely to continue. This is called verifiable income, and it forms the basis for assessing repayment capacity. Typical documentation includes: Β Recent pay stubs (typically two months) Β W-2 forms from the past two years Β Federal tax returns (especially for self-employed borrowers) Β Bank statements Β Profit and loss statements for business owners Self-employed borrowers often face stricter scrutiny. Lenders may require two years of tax returns filed with the Internal Revenue Service (IRS) and calculate income using net profit rather than gross revenue. Fannie Mae guidelines, which govern conventional conforming loans, require lenders to document income with precision. Employment gaps, recent job changes, or irregular income may trigger additional review. 3. Debt-to-Income Ratio (DTI) Your debt-to-income ratio measures how much of your gross monthly income goes toward existing and new debt payments. It is one of the most important indicators of borrower solvency. DTI is calculated as: Total Monthly Debt Payments / Gross Monthly Income x 100 Lenders evaluate two DTI figures: Β  Β  Β  Front-end DTI: Only housing costs (mortgage principal, interest, taxes, insurance) divided by gross income. Most conventional lenders prefer this below 28%. Β  Β  Β  Back-end DTI: All monthly debts (housing + car loans + student loans + credit cards + other obligations) divided by gross income. Most conventional lenders prefer this below 36-43%. Fannie Mae and Freddie Mac allow DTI ratios up to 45-50% in some cases with compensating factors. FHA loans allow up to 57% back-end DTI in certain circumstances, though lender overlays often apply stricter limits. 4. Assets and Down Payment Lenders evaluate your asset liquidity β€” the money and resources you have available to cover the down payment, closing costs, and financial reserves after closing. Having reserves demonstrates financial stability and reduces lender risk. For conventional loans, a 20% down payment eliminates the need for private mortgage insurance (PMI). However, borrowers can qualify with as little as 3% down through programs like Fannie Mae’s HomeReady or Freddie Mac’s Home Possible. FHA loans require as little as 3.5% down with a credit score of 580 or higher. VA loans and USDA loans offer zero down payment options for eligible borrowers. Assets can include: Β  Β  Β  Checking and savings accounts Β  Β  Β  Investment accounts (stocks, bonds, mutual funds) Β  Β  Β  Retirement accounts (often counted at 60-70% of value) Β  Β  Β  Gift funds (with documentation requirements) Β  Β  Β  Proceeds from sale of existing property 5. Property or Loan Purpose For mortgage loans, the property itself must meet certain standards. An independent appraiser assesses the home’s market value, and lenders will not lend more than the property is worth (loan-to-value ratio or LTV must meet program limits). For SBA loans through the Small Business Administration, the purpose of the loan and how the funds will be used are closely scrutinized. The business must operate for profit, meet SBA size standards, and demonstrate a need for the financing. How to Prepare for Lender Borrowing Criteria: Step by Step Follow these steps before submitting any loan application to maximize your chances of approval and secure the best possible terms. Β  Pull Your Credit Reports β€” Request free credit reports from all three bureaus at AnnualCreditReport.com. Review for errors, disputed accounts, or outdated negative items. Β  Check Your FICO Score β€” Many banks and credit card companies offer free FICO scores. Know your score and understand which tier you fall in before applying. Β  Calculate Your DTI β€” Add up all monthly debt obligations and divide by your gross monthly income. If your back-end DTI exceeds 43%, work on paying down debt before applying. Β  Gather Income Documentation β€” Collect recent pay stubs, W-2s, tax

Real Cost of Refinancing
General

The Real Cost of Refinancing | What Every Homeowner Must Know

Refinancing sounds straightforward: get a lower rate, pay less each month, save money. But the real cost of refinancing is rarely what it appears on the surface. Between closing fees, loan-to-value ratio requirements, escrow account balance adjustments, and the risk of mortgage term extension, the true financial picture is more complex than a lower monthly payment suggests. Many homeowners across high-cost markets like New York City and California refinance without fully accounting for upfront expenses β€” and end up paying more over time than if they had stayed with their original loan. Understanding the complete cost of a refinance is the difference between a smart financial move and an expensive mistake. This guide covers every component of the real cost of refinancing: closing costs, break-even analysis, rate differentials, hidden fees, PMI implications, and the situations where refinancing does β€” and does not β€” make financial sense. Data from Freddie Mac, the Federal Reserve, the Consumer Financial Protection Bureau, and major lenders like Rocket Mortgage and Chase Bank inform the framework throughout. What Is the Real Cost of Refinancing?Β  The Consumer Financial Protection Bureau (CFPB) emphasizes that refinancing decisions should account for the full cost of the transaction, not just the monthly payment reduction. A refinance that appears to save $200/month but costs $8,000 in closing fees requires 40 months of unchanged ownership just to break even. What Closing Costs Are Included in a Refinance? Closing costs on a refinance are the upfront expenses paid to complete the new loan transaction. These typically total 2% to 6% of the loan amount, varying by loan size, lender, state, and loan type. On a $350,000 loan, this range represents $7,000 to $21,000 in upfront expenses. Lender Fees Lender fees are paid directly to the mortgage company and include: Origination fee: Often 0.5% to 1% of the loan amount. Covers the lender’s cost of processing the loan. Underwriting fee: Typically $400 to $900. Covers the cost of evaluating your financial profile and underwriting criteria review. Application fee: Some lenders charge $75 to $300 just to apply. Many waive this fee β€” always ask. Rate lock fee: If you lock your rate for an extended period (60-90 days), some lenders charge a fee. Lenders registered with the Nationwide Multistate Licensing System (NMLS) are required to disclose all fees on the Loan Estimate within three business days of your application. Review this document carefully and compare across multiple lenders. Third-Party Fees Third-party fees are paid to outside service providers and typically include: Appraisal fee: $300 to $700 depending on property type and location. High-cost markets like New York City and California often run toward the top of this range. Title search and insurance: $500 to $1,500. Confirms ownership and protects against title defects. Attorney fees: Required in some states. Varies widely by location. Survey fee: May be required, typically $150 to $400. Credit report fee: $30 to $50. Government and Recording Fees Recording fees: $25 to $250, paid to the county to record the new mortgage. Transfer taxes: Required in some states and localities. In New York City and parts of California, transfer taxes on refinances can be significant β€” always verify local requirements before estimating total cost. Prepayment penalty: Some existing mortgages carry prepayment penalties if paid off early. Review your current loan documents before initiating a refinance. Escrow Account Balance Adjustments An often-overlooked component of the real cost of refinancing is the escrow account balance. When you refinance, your existing escrow account (holding funds for property taxes and insurance) is typically returned to you β€” but it may take 30-45 days. Meanwhile, your new lender will collect upfront escrow deposits for your new loan, which can require 2-3 months of property tax and insurance payments at closing. In practice, this means you may need to fund a new escrow account even while waiting for your old one to be refunded. This can represent $2,000 to $6,000 or more in additional cash needed at closing in high-tax areas. The Financial Break-Even Analysis: The Most Important Calculation The break-even point is the number of months you must remain in your home with the new loan before your monthly savings exceed your upfront refinancing costs. This is the single most important calculation in any refinancing decision.Important nuances to the break-even calculation: Tax deductibility: Mortgage interest is deductible for many itemizing homeowners, which affects the true after-tax savings. Consult a tax professional for your specific situation. Interest rate differential: The interest rate differential between your old and new loan drives monthly savings. A 0.5% rate reduction on a $300,000 balance saves roughly $80-$100/month. A 1.5% reduction saves roughly $250-$280/month. Exact amounts vary with your specific loan. Opportunity cost: Upfront expenses paid in cash represent money that could have earned returns elsewhere. Some financial models account for this opportunity cost in the break-even calculation. No-Closing-Cost Refinance: Lower Upfront, Higher Long-Term Cost A no-closing-cost refinance rolls all upfront expenses into the loan balance or accepts a higher interest rate in exchange for the lender covering closing costs. This eliminates the cash needed at closing but increases either the loan amount or the monthly interest cost β€” shifting expenses from upfront to long-term. No-closing-cost refinances are best evaluated by calculating the total interest paid over the expected remaining ownership period, not just the break-even point. Bankrate and Zillow Home Loans both offer refinance calculators that model this comparison. The Hidden Cost of Mortgage Term Extension One of the most significant and frequently overlooked costs of refinancing is mortgage term extension. When a homeowner who is 8 years into a 30-year loan refinances into a new 30-year loan, they add 8 additional years of payments to their financial obligation. Even if the new interest rate is lower, the extended term means more total interest paid over the combined lifetime of both loans. This is not a risk β€” it is a mathematical certainty unless the rate reduction is substantial enough to offset the additional years of interest. Example: A homeowner 10

Front-End DTI vs Back-End DTI
General

Front-End DTI vs Back-End DTI | A Complete Guide for Borrowers

When you apply for a mortgage, two numbers carry more weight than almost any other factor in the underwriting process: your front-end DTI and your back-end DTI. These two debt-to-income ratios tell lenders how much of your income is already committed to housing and to debt broadly and together they define your mortgage eligibility before your credit score, down payment, or loan type even enters the conversation. Understanding front-end DTI vs back-end DTI is essential for any borrower who wants to know where they stand before applying. Many first-time buyers are surprised to discover that a strong credit score does not compensate for a back-end DTI that exceeds lender thresholds. Others underestimate how housing costs beyond the mortgage payment taxes, insurance, HOA feesΒ  affect their front-end ratio. This guide explains exactly what each ratio measures, how to calculate both, what limits apply across different loan programs including FHA, VA, USDA, and conventional loans, and what practical steps can improve your ratios before you apply. Tools from Rocket Mortgage, Bankrate, and Zillow Home Loans can help you run these numbers β€” but understanding the mechanics first puts you in a stronger position to act on the results. What Is Front-End DTI vs Back-End DTI?Β  The Consumer Financial Protection Bureau (CFPB) identifies debt-to-income ratio as one of the primary factors lenders use in mortgage qualification decisions. While no single DTI threshold is universally mandated by law, the Qualified Mortgage (QM) framework β€” which gives lenders legal protections β€” has historically aligned with back-end DTI limits near 43%, though Fannie Mae and Freddie Mac allow higher ratios in specific scenarios. Front-End DTI: The Housing Expense Ratio Explained Front-end DTI also called the housing expense ratio or housing ratio β€” focuses exclusively on the costs of housing. It answers one question: what percentage of your gross monthly income goes toward paying for your home? What Is Included in Front-End DTI? Front-end DTI includes all components of your monthly housing payment, commonly abbreviated as PITI: Principal: The portion of your mortgage payment that reduces the loan balance. Interest: The cost of borrowing, calculated on the remaining loan balance. Taxes: Monthly property tax portion, typically held in escrow. Insurance: Homeowner’s insurance monthly escrow portion. HOA fees: If applicable, homeowners association fees are included. Private mortgage insurance (PMI): If your down payment is below 20% on a conventional loan, PMI is included. The formula is: Front-End DTI = Monthly Housing Costs (PITI) / Gross Monthly Income x 100 Front-End DTI Example Gross monthly income: $6,500 Estimated PITI (mortgage P&I + taxes + insurance + HOA): $1,690 Front-End DTI: 1,690 / 6,500 x 100 = 26% This borrower falls within the commonly referenced 28% front-end guideline and would meet the housing expense threshold for most conventional lenders. Why Front-End DTI Matters The front-end ratio captures the affordability index for housing specifically. A borrower with low overall debt but a very high housing payment relative to income can still face financial strain. Lenders use this ratio to ensure that the housing obligation itself β€” regardless of other debts β€” is proportionate to income. In practice, front-end DTI is most closely scrutinized for FHA loans, which have an official 31% front-end limit as a standard guideline. For conventional loans following Fannie Mae and Freddie Mac guidelines, there is no strict front-end cap β€” though most lenders apply a practical 28-31% benchmark in their creditworthiness analysis. Back-End DTI: The Total Debt Ratio Explained Back-end DTI also called the total debt ratio provides a wider view of a borrower’s financial obligations. It includes housing costs plus every other recurring monthly debt payment, making it the more comprehensive measure of income-to-debt relationship. What Is Included in Back-End DTI? Back-end DTI includes all housing costs (same as front-end DTI) plus: Auto loan payments Student loan payments (minimum required payment or calculated payment per loan program rules) Credit card minimum monthly payments Personal loan installments Child support or alimony payments (if obligated) Co-signed loan payments (if you are legally obligated) Any other recurring monthly installment or revolving debt obligations The formula is: Back-End DTI = (Total Monthly Housing Costs + All Monthly Debt Payments) / Gross Monthly Income x 100 Back-End DTI Example Gross monthly income: $6,500 Monthly housing costs (PITI): $1,690 Other monthly debts: $850 (car loan $450 + student loans $250 + credit card minimums $150) Total monthly obligations: $2,540 Back-End DTI: 2,540 / 6,500 x 100 = 39.1% This borrower’s back-end DTI of 39.1% exceeds the classic 36% guideline but falls within Fannie Mae’s expanded 45% limit. Depending on their FICO score and reserves, a conventional loan may still be achievable. An FHA loan could also accommodate this ratio with compensating factors. Why Back-End DTI Is the More Critical Number While front-end DTI measures housing affordability, back-end DTI is the underwriting risk factor that lenders weight most heavily. A borrower may have a modest housing payment but carry significant debt from student loans, auto loans, or credit cards. Back-end DTI captures this total picture and reveals the borrower’s personal finance liquidity β€” how much income remains after all obligations are met (discretionary income). FICO research supports the relationship between high back-end DTI and elevated default risk. Lenders use back-end DTI alongside FICO scores and loan-to-value ratios as the three primary factors in lending cap threshold decisions. Front-End and Back-End DTI Limits by Loan Program Different loan programs set different official DTI thresholds. Understanding which program’s limits apply to your situation helps you evaluate your mortgage eligibility accurately before applying. Conventional Loans: Fannie Mae and Freddie Mac Conventional conforming loans follow Fannie Mae and Freddie Mac guidelines. There is no official front-end DTI cap in Fannie Mae’s Selling Guide, though most lenders apply a 28% practical threshold. The back-end DTI limit is typically 45% through automated underwriting systems (DU for Fannie Mae, LPA for Freddie Mac), with some approvals reaching 50% for borrowers with strong FICO scores and significant reserves. Manual underwriting of conventional loans generally applies stricter DTI caps, often 36-45%

DTI Ratio Explained
General

DTI Ratio Explained | What It Is and How to Lower It

When you apply for a mortgage, auto loan, or personal loan, lenders look beyond your credit score. Your DTI ratio β€” short for debt-to-income ratio β€” is one of the most important numbers in the underwriting process. It tells lenders how much of your monthly income is already committed to debt payments, and whether you can realistically take on more. Many borrowers are surprised to learn that a strong credit score alone does not guarantee approval. A high DTI ratio can block a loan application even when your credit history is spotless. Understanding what your DTI ratio is, how lenders calculate it, and what you can do to improve it is essential before you apply for any major loan. This guide covers everything you need to know: the DTI definition, how to calculate it step by step, what thresholds different loan programs use, how major lenders and agencies like Fannie Mae, Freddie Mac, the Federal Housing Administration, the Department of Veterans Affairs, and the Consumer Financial Protection Bureau apply it, and practical strategies to lower your DTI before you apply. What Is a DTI Ratio? A DTI ratio (debt-to-income ratio) is the percentage of a borrower’s gross monthly income that is used to pay monthly debt obligations. It helps lenders measure creditworthiness and financial solvency by comparing how much you owe each month to how much you earn. The main purpose is to assess your ability to repay a new loan without becoming overextended financially. DTI Calculator is expressed as a percentage. For example, if your gross monthly income is $6,000 and your total monthly debt payments are $2,100, your DTI ratio is 35%. Lenders use DTI as a core piece of underwriting criteria alongside your credit score, employment history, assets, and loan-to-value ratio. The Consumer Financial Protection Bureau (CFPB) recognizes DTI as a key factor under the Qualified Mortgage rule, which establishes standards lenders must meet to ensure borrowers have the ability to repay. Front-End vs Back-End DTI There are two versions of DTI used in mortgage underwriting: Front-end DTI (housing ratio): Front-end DTI (housing ratio): Only includes your proposed housing costs β€” principal, interest, property taxes, homeowner’s insurance, and HOA fees if applicable (collectively called PITI). Most conventional lenders prefer a front-end DTI at or below 28%. Back-end DTI (total DTI): Includes all monthly debt obligations β€” your housing costs plus credit card minimum payments, auto loans, student loans, personal loans, child support, alimony, and any other recurring debt. This is the number most lenders focus on and the one most commonly referred to simply as ‘DTI.’ How to Calculate Your DTI Ratio: Step by Step Add up all your monthly debt payments. Include: minimum credit card payments, auto loan payments, student loan payments, personal loan payments, child support or alimony obligations, and any other recurring monthly debt. Do not include utilities, groceries, insurance premiums (other than those included in a mortgage payment), or subscriptions. Determine your gross monthly income. This is your total income before taxes and deductions. Include wages, salary, self-employment income (typically averaged over 2 years), rental income (if documented), alimony received, and other verifiable income sources. Divide your total monthly debt payments by your gross monthly income. Multiply the result by 100 to get your DTI percentage. For a mortgage application, add your projected new housing payment (PITI) to your existing debts before dividing. This gives lenders the DTI you will carry after the new loan closes. Compare your result to the thresholds used by the loan program you are applying for (see the table below). DTI Formula:Β  DTI (%) = (Total Monthly Debt Payments Γ· Gross Monthly Income) Γ— 100 Example: $2,100 monthly debts Γ· $6,000 gross monthly income Γ— 100 = 35% DTI Worked Example Borrower profile: Gross monthly income = $7,500. Monthly obligations: auto loan $450, student loan $300, credit card minimums $150, proposed new mortgage (PITI) $1,800. Total monthly debts: $450 + $300 + $150 + $1,800 = $2,700 Back-end DTI: $2,700 Γ· $7,500 Γ— 100 = 36% Front-end DTI (housing only): $1,800 Γ· $7,500 Γ— 100 = 24% In this scenario, the borrower’s back-end DTI of 36% falls within the range accepted by most conventional lenders and Fannie Mae / Freddie Mac guidelines (which generally allow up to 45%–50% with compensating factors). The front-end DTI of 24% also falls below the common 28% guideline. DTI Ratio Limits by Loan Type Loan Type Front-End DTI Back-End DTI Notes Conventional (Fannie Mae / Freddie Mac) ≀28% (preferred) ≀45%–50% Higher DTI may be approved via automated underwriting system (AUS) with compensating factors such as strong reserves or high credit score. FHA (Federal Housing Administration) ≀31% (preferred) ≀43% (guideline); up to 57% with compensating factors Manual underwriting may allow higher DTI with documented compensating factors. FHA guidelines set by HUD. VA (Department of Veterans Affairs) No fixed limit ≀41% (preferred) VA does not set a strict DTI cap but uses residual income assessment as the primary affordability measure. Higher DTI accepted with sufficient residual income. USDA Rural Development ≀29% (preferred) ≀41% (guideline) Higher ratios may be approved with compensating factors through the USDA guaranteed loan program. Jumbo Loans Varies by lender ≀43% (common) Private lenders set their own thresholds; many require lower DTI for loans above conforming limits due to higher risk. Qualified Mortgage (CFPB Rule) N/A ≀43% (general cap) The CFPB Qualified Mortgage rule generally caps DTI at 43% for standard QM loans, though GSE (Fannie/Freddie) loans may qualify under a separate patch. Rules subject to change; verify current CFPB guidance. How Lenders and Agencies Use DTI in Underwriting Fannie Mae and Freddie Mac Conventional loans sold in the secondary mortgage market must meet Fannie Mae or Freddie Mac eligibility standards. Both agencies use automated underwriting systems β€” Fannie Mae’s Desktop Underwriter (DU) and Freddie Mac’s Loan Product Advisor (LPA) β€” to evaluate loan files. These systems can approve loans with back-end DTI ratios above 45% when compensating factors like high credit scores, significant cash reserves, or low loan-to-value ratios are

Scroll to Top